Looker Studio is Google's free tool that turns your data into reports and dashboards you share with a simple link. Since April 2026, it carries its original name again, Data Studio: same product, same reports, and the old address redirects to the new one. You use it to bring your Google Ads, GA4, Search Console or Google Sheets numbers into one place, show them as charts, and share them with someone who will never open the ad platform. It is for the advertiser who wants to follow campaigns at a glance, and for anyone who reports to a partner, a network or a client.
What Is Looker Studio Used For
Google describes it in the Data Studio help as a no-cost tool that turns your data into shareable dashboards and reports, built with drag and drop. On an ad account, it does three jobs:
- Bring together: Google Ads, GA4, Search Console, YouTube, a Google Sheet or a CSV file in the same report, instead of five open tabs.
- Translate: keep the few numbers that matter for your business and show them as lines, bars or tables that a person outside advertising reads without a manual.
- Share: invite someone to view the report, schedule an email delivery or embed the report in a page, without giving anyone access to your Google Ads account.
Think of Data Studio as a shop window in front of your tools. It shows what each source has measured, at the moment it looks. If a shelf in the shop is empty, the window is empty too. That is what makes it reliable, and that is also what sets its limits.
How Looker Studio Works
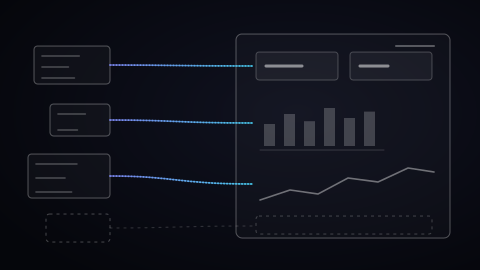
Three pieces fit together, and the help page on connectors, data sources and credentials describes them in this order:
- The connector fetches the data from a platform. The ones Google built, for Google Ads, Google Analytics, Google Sheets or Search Console, are free. Community connectors, built by partners for other platforms, may cost money.
- The data source sets the account, the fields and the credentials. A data source created from the home page can be reused in several reports.
- The report places charts, tables, filters and the date range control on top of that source.
The data stays where it lives. According to the help page on data sources, most of them keep a live connection to the platform, and Data Studio only keeps a temporary copy. This cache follows a data freshness setting: every 12 hours for Google Ads, a frequency you cannot change, and every 15 minutes by default for a Google Sheet. A report editor can force a refresh at any time.
Two settings decide what other people see. With owner's credentials, a viewer sees the numbers without having their own access to the ad account, and Google advises sharing this kind of report only with people you trust. With viewer's credentials, each person needs their own access. And when a question covers two platforms, data blending joins up to five sources in one chart, for example Google Ads costs and GA4 sessions matched on the campaign name.
What The Google Ads Connector Shows
The Google Ads connector links one data source to one account. With a manager account, one source can include up to 50 sub-accounts, as long as report viewers also have access to the manager account. Campaigns and ad groups with zero impressions do not appear: a report that lists fewer campaigns than the interface may have this explanation.
The data control changes everything when you manage several accounts. Added to a report, it turns it into a template: the viewer picks the account, and the same pages fill with their own numbers. You build the structure once, and each new account only needs its source connected.
A Real Example: The Report Of A Lead Generation Account
A lead generation account in the credit sector that I work with asked me for a quarterly Data Studio report, with a clear goal: explain to its network what is paid for and how the campaigns work. I started from one of my templates, since it only needs the account's source connected. The dashboard presented in January 2026 has five views. It shows the period, the active campaigns and performance by device, where mobile brings the most clicks.
My Data Studio account, read through the API on October 16, 2026, holds 8 client reports, for 7 clients, next to templates and tests. My oldest template dates from January 2024.
The most useful question came during the presentation: why does the report count fewer leads than the client's internal file? The dashboard shows what Google Ads measures. People who refuse cookies, part of iPhone users and clients who came through word of mouth are not in it. The window was showing exactly what the source contained.
Looker Studio, GA4 And Looker: Who Does What
Three names cross paths, and each has a distinct role:
- GA4 collects and measures: it records the visits and events on your site. Data Studio displays them, with other sources next to them.
- Looker is another Google Cloud product, an enterprise business intelligence platform. Google's comparison page recommends it for organizations that need governance for key metric definitions, robust data access permissions and custom applications.
- Data Studio targets self-service reporting, interactive dashboards and access to more than 1,000 data sources, for anyone with a Google account.
There is also a paid version, Data Studio Pro, with administration and collaboration features for companies, such as up to 200 delivery schedules per report. Its 30-day trial is free, then billing starts automatically. For an advertiser or a small business, the free version contains everything this guide describes.
Common Mistakes
- Reading the report as real time. With a refresh every 12 hours, the Google Ads number shown at 9 a.m. can come from the evening before. For a decision today, the Google Ads interface is the reference.
- Comparing the report with the interface without checking the dates. A campaign with zero impressions does not appear in the connector, so the report's list can be shorter than the one in Google Ads. For amounts, first check that both show the same date range and the same account.
- Sharing owner's credentials without thinking. Anyone with access to the report then sees the account's numbers. Share it with named people, and keep edit access for yourself.
- Forgetting the cost of a third-party connector. Google connectors are free. A community connector for another platform can require a subscription. Read its terms before you build a report on it.
The Limits To Know
Data Studio displays what your measurement tools record. A conversion that the GA4 property or the Google Ads tag does not capture will stay missing from the best-looking report. The quality of a dashboard starts with tracking, with Google Tag Manager and enhanced conversions.
The other limits come from the help pages themselves: five sources at most per blend, 50 sub-accounts at most per Google Ads source, and a fixed 12-hour refresh for Google Ads. When the volume or the joins go beyond this, the data goes through a warehouse such as BigQuery, which Data Studio can read. Before you build one, ask who will open it and how often: a dashboard earns its place when someone reads it, and a regular meeting with the numbers on screen sometimes does the same job.
The Three Most Searched Questions
Is Looker Studio free? Yes. Data Studio is free for anyone with a Google account, and the connectors Google built are free too. Two things cost money: some community connectors, built by partners for other platforms, and Data Studio Pro, the enterprise version, whose 30-day trial then switches to automatic billing.
Is Looker Studio the same as Data Studio? Yes, it is the same tool. It was called Data Studio, carried the Looker Studio name for a few years, then Google gave it back its original name in April 2026. Your reports need no update, and the address lookerstudio.google.com redirects automatically to datastudio.google.com.
How do I sign in to Looker Studio? Open datastudio.google.com with your Google account, with no separate sign-up. Create a blank report, choose the Google Ads connector, authorize access, then select the account. For several accounts at once, go through your manager account: up to 50 sub-accounts per data source.
Before you build your first report, open your conversion actions in Google Ads and write down the one your campaigns optimize for: it is the number your dashboard needs to show first. In an account audit, I check that your conversions are properly counted, deduplicated, and sent back to the algorithm: it is the base of any reporting on a Google Ads campaign.